Setting New CO2 Records While Setting Performative CO2 Targets
How thirty years of global climate commitments measured up against the one thing that doesn't lie: what the world actually burned.

On the 12th of December, 2015, in a conference hall outside Paris, the representatives of 196 nations signed what was described as a historic turning point in the human relationship with the atmosphere. The Paris Agreement committed the world to holding global warming well below 2°C and pursuing efforts to limit it to 1.5°C. Speeches were made. Photographs were taken. The French foreign minister called it “beautiful and historic.”
Within days, the world’s energy systems resumed their normal operation. By 2024, global CO₂ emissions from fossil fuels and industry reached 37.4 gigatonnes — a record. Fossil fuels still supplied over 80 percent of all primary energy on earth, roughly where they had been when the agreement’s predecessor, the Rio Earth Summit, was held in 1992.
This is the pattern. Not just of Paris, but of every major climate commitment made over thirty years. A target is announced. The data immediately available would, on inspection, have revealed the target to be inconsistent with the physical trajectory of global energy systems. The target is celebrated anyway. Emissions continue to rise. A new target is set.
The chart below is the complete record. Every arrow is a promise. The red line is what happened.
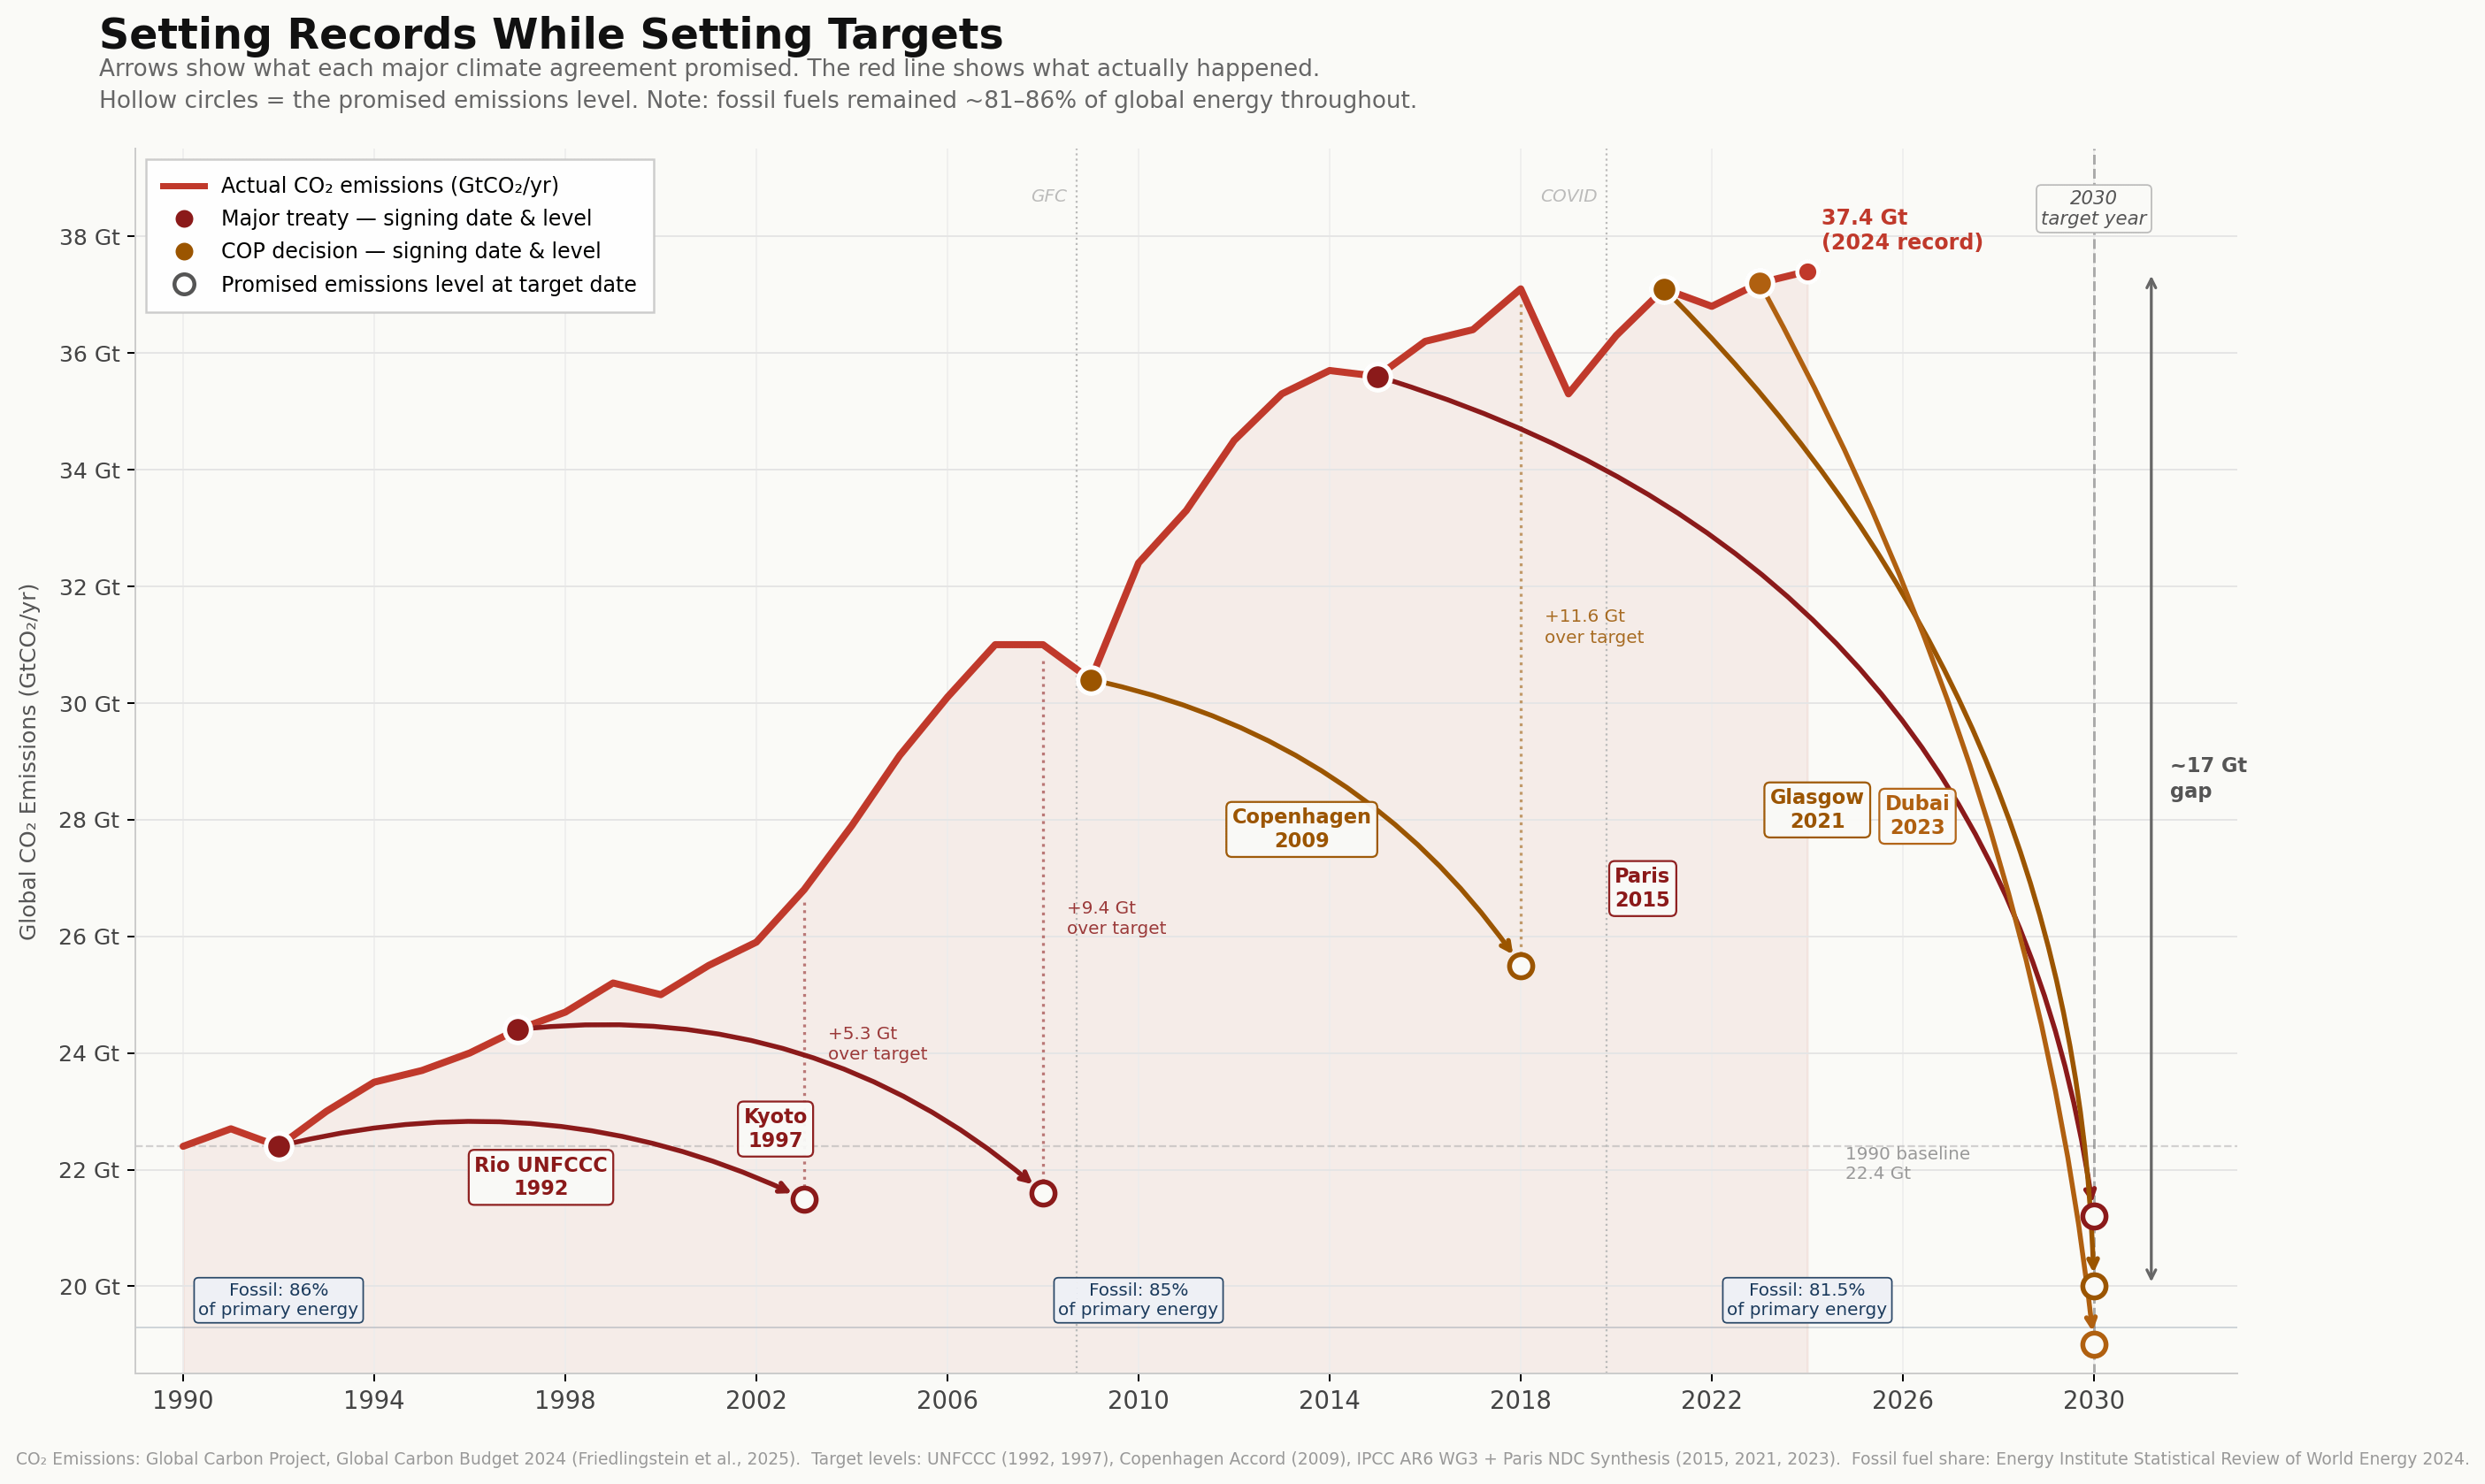
Each arrow shows the emissions trajectory required by a major climate agreement, drawn from the moment of signing to its stated target date and level. Hollow circles mark the promised emissions level. The red line is actual annual CO₂ output. Note: fossil fuels supplied 86% of global primary energy in 1992, 85% in 2010, and 81.5% in 2024. CO₂ Emissions: Global Carbon Project, Global Carbon Budget 2024 (Friedlingstein et al., 2025, Earth System Science Data). doi.org/10.5194/essd-17-965-2025. Target levels derived from: UNFCCC (1992, 1997), Copenhagen Accord (2009), IPCC AR6 WG3 + Paris NDC Synthesis Reports (2015, 2021, 2023). Fossil fuel share: Energy Institute Statistical Review of World Energy 2024 (74th ed.).
What the chart does not show — because it requires words to convey — is that at the moment each of those arrows was drawn, the information needed to know it would not be followed existed in published, publicly available data. This is not a retrospective judgment. It is an accounting of what was knowable, what was known, and what was set aside.
The Baseline Nobody Wanted to Discuss
Fossil fuels — oil, coal, and natural gas — are not simply an energy source that can be replaced by building enough wind turbines and solar panels. They are the structural material of the industrial economy. Think of them less as fuel in a tank and more as the rebar in every wall of a civilization-sized building. You cannot pull the rebar without bringing the structure down — unless you have already built an alternative skeleton capable of bearing the same load.
Coal reduces iron ore into the steel that makes every wind turbine. Natural gas, through the Haber-Bosch process, synthesizes the nitrogen fertilizers that sustain roughly half of all human life on earth. Remove that process tomorrow and within a growing season you have a food crisis without historical precedent. Oil is the molecular precursor for plastics, pharmaceuticals, pesticides, lubricants, asphalt, and synthetic fibers. Aviation, maritime shipping, cement, and primary steel manufacturing have no scalable, cost-competitive substitute today — in 2026 — after the most intensive period of clean energy investment in human history.
In 1990, fossil fuels supplied approximately 86 percent of global primary energy, rising in absolute volume for four consecutive decades. The IEA published those numbers annually. Every government that signed every agreement discussed below had access to them. None built their targets around what those numbers implied.
The result: fossil fuels were 86 percent of primary energy in 1990. They are 81.5 percent today. That five-point decline across thirty-four years of sustained international effort represents a share shift. The absolute volume of fossil fuel burned increased by 67 percent. The share fell only because total energy demand grew faster than any substitution could reach. The world did not transition away from fossil fuels. It added renewables on top of them.
Every climate target ever set assumed a transition was underway. The data consistently showed net additions instead.
Rio, 1992: The Promise That Had No Number
The United Nations Framework Convention on Climate Change, signed at Rio de Janeiro in June 1992, established the legal architecture within which every subsequent climate agreement has operated. Its stated objective was to stabilize greenhouse gas concentrations “at a level that would prevent dangerous anthropogenic interference with the climate system.” No temperature was specified. No emissions level was defined. No deadline was named.
At signing, global CO₂ emissions stood at approximately 22.4 gigatonnes per year, rising at roughly 1.5 percent annually. China and India were industrializing at rates any energy analyst could extrapolate. The convention contained no binding reduction commitments — only aspirations to “adopt national policies,” on no fixed timetable, with no enforcement.
In the eight years following Rio, global CO₂ emissions rose from 22.4 Gt to 25.0 Gt — an increase of 12 percent. The UNFCCC framework remained in continuous operation throughout. No country was penalized. No mechanism existed to penalize them. Rio was the template: climate governance would operate through aspiration rather than obligation, through language rather than mechanism. Every agreement that followed inherited that foundation.
Kyoto, 1997: The First Real Number, Already Wrong
The Kyoto Protocol, adopted in December 1997, was the first climate agreement to attach specific numbers to specific countries. Thirty-seven industrialized nations committed to reducing their collective greenhouse gas emissions by an average of five percent below 1990 levels during 2008 to 2012. The EU accepted minus eight percent. The US, minus seven. Japan and Canada, minus six.
Two structural flaws were visible at signing. First, the United States — the world’s largest emitter in 1997 — showed no credible path to ratification. The Senate had voted 95 to zero against any agreement exempting developing nations [1]. The Clinton Administration signed anyway. Second, Kyoto exempted all developing nations. China’s emissions had been growing at roughly five percent per year for a decade. India’s were accelerating. Both were outside the agreement entirely.
The atmosphere does not apply equity adjustments to carbon molecules. A tonne emitted in Shanghai has the same warming effect as one emitted in Stuttgart.
By the time Kyoto’s first commitment period opened in 2008, global emissions had risen to approximately 31 Gt — nearly 40 percent above the 1990 baseline that its targets were measured against. The US never ratified. Canada ratified in 2002 and withdrew in 2011. The five-percent reduction among Annex I nations that was technically achieved came largely through the economic collapse of the former Soviet bloc, not deliberate decarbonization. Global emissions were higher in every single year of Kyoto’s commitment period than when it was signed.
Copenhagen, 2009: The Alarm That Was Heard and Ignored
By December 2009, the evidence was unambiguous. Emissions had risen in every year since Rio. Kyoto’s architecture had failed structurally before its commitment period even began. The financial crisis of 2008 had produced the only meaningful emissions dip in the entire post-Rio record — and it had nothing to do with climate policy. The moment the economy recovered, emissions resumed their climb.
Copenhagen produced no binding agreement. What emerged was a three-page political accord — not submitted to the full conference for adoption — in which major economies acknowledged a 2°C limit and pledged voluntary national actions. CO₂ emissions in 2009 stood at approximately 30.4 Gt, 36 percent above the 1990 baseline. Within two years, emissions would set a new record. The lesson the climate governance system drew from Copenhagen was not that voluntary commitments were structurally inadequate. It was that a better voluntary commitment was needed.
Paris, 2015: The Agreement That Disproved Itself at Signing
The Paris Agreement is the most celebrated climate document in history. It is also the one whose internal contradiction was most clearly documented at the moment it was adopted. When 196 nations agreed in December 2015 to hold warming to well below 2°C and pursue efforts toward 1.5°C, the UNFCCC had already published its synthesis of the national pledges submitted alongside the agreement. Those pledges, if fully implemented, were consistent with approximately 2.7°C of warming [2]. The gap between the agreement’s goal and the aggregate of its commitments was not a future problem to be solved. It was a present reality, in writing, on the day of signing.
The 1.5°C target carried a further problem visible to anyone who consulted the IPCC’s carbon budget literature. At 2015 emission levels, the remaining budget for a 50 percent chance of staying below 1.5°C would be exhausted in approximately a decade [3]. Meeting the target required not merely a peak in emissions — it required an immediate, steep, sustained decline of a magnitude never achieved by any major economy outside of economic collapse.
The IPCC was explicit about what “1.5°C by 2050” required at the interim: a 43 percent reduction in global CO₂ from 2019 levels by 2030 [4]. Not by 2050. By 2030 — fifteen years after signing, four years from today. Paris set that clock. Nobody in Le Bourget talked seriously about what it would take to meet it.
Emissions in 2015, the year Paris was signed: 35.6 Gt. Emissions in 2024: 37.4 Gt — a record. Human-induced warming crossed 1.5°C in 2024, roughly a decade ahead of the median projection at signing [5]. Current policies put the world on a trajectory of approximately 2.7°C — identical to the pre-Paris projection. The Paris Agreement changed the trajectory of global emissions by zero.
The Net-Zero Cascade, 2019–2023: Universal Commitment, Zero Mechanism
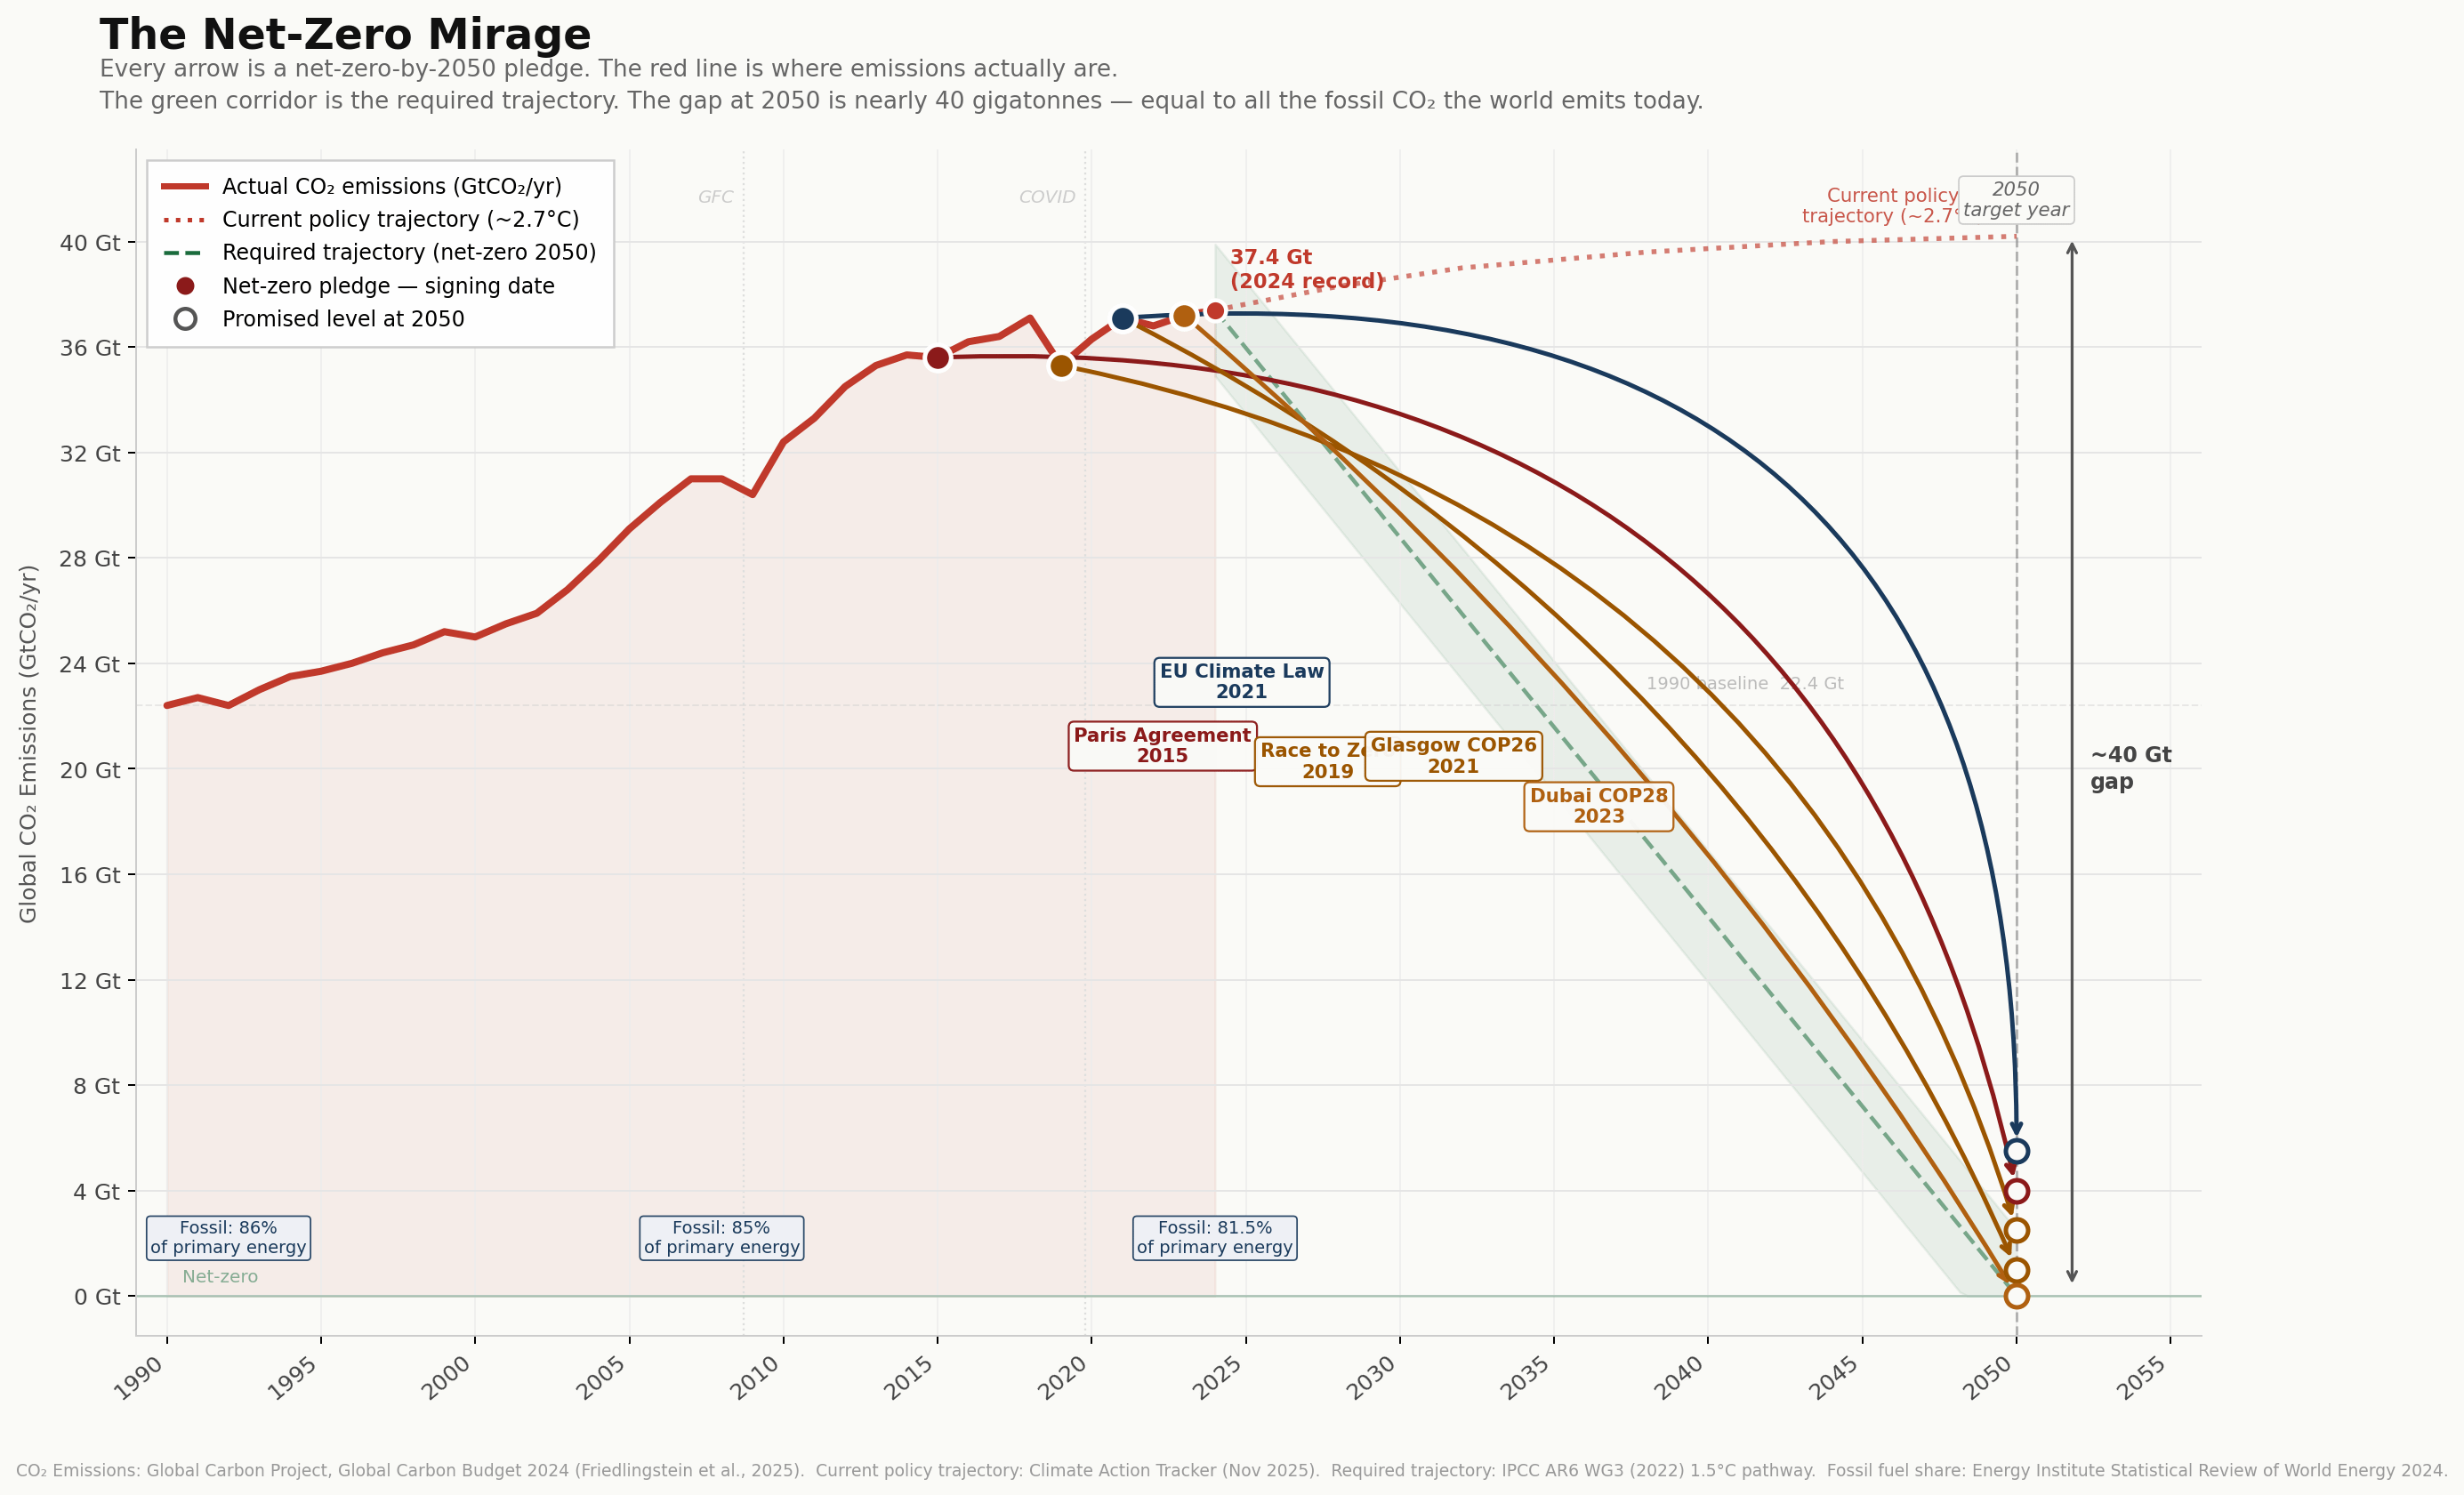
Every arrow is a net-zero-by-2050 pledge. The red line is actual CO₂ emissions. The dotted red line is the current policy trajectory (~2.7°C). The green corridor is the required trajectory to reach net-zero by 2050. The gap at 2050 between the current trajectory and the promised level is nearly 40 gigatonnes — roughly equal to all fossil CO₂ the world emits today. CO₂ Emissions: Global Carbon Project, Global Carbon Budget 2024 (Friedlingstein et al., 2025). Current policy trajectory (~2.7°C): Climate Action Tracker, November 2025. climateactiontracker.org. Required trajectory: IPCC AR6 WG3 (2022) 1.5°C pathway. doi.org/10.1017/9781009157926. Fossil fuel share: Energy Institute Statistical Review of World Energy 2024.
Between 2019 and 2023, net-zero by 2050 became the dominant framework of global climate commitment. The EU legislated it. The UK legislated it. China announced 2060. India announced 2070. By October 2025, approximately 145 countries covering 77 percent of global emissions had made some form of net-zero pledge [6].
Every one of those pledges rested on the same unstated assumption: that the 2030 interim requirement would somehow be met. Paris made the 2030 promise in 2015. Glasgow reaffirmed it in 2021 while fossil consumption set a new record. Dubai repeated it in 2023 while fossil consumption set another. Three separate agreements, in three separate years, pointing to the same milestone — none accompanied by a single enforcement mechanism, a binding carbon price, or a credible account of which fossil systems would be retired and when.
Paris promised it. Glasgow reaffirmed it. Dubai repeated it. The 2030 target has been set three times in nine years. Emissions have risen in every one of those years.
The year 2030 is four years away. We are at 37.4 Gt. The 2030 target is approximately 20 Gt. Closing that gap would require the largest and fastest reduction in energy system output in recorded history — roughly equivalent to eliminating the combined energy consumption of China and the United States, in four years, without disrupting the food supply, industrial output, or the economic growth that three billion people in developing nations depend on. It will not happen. It was not going to happen when Paris was signed. It was not going to happen when Glasgow reaffirmed it. And it was not going to happen when Dubai repeated it.
Meanwhile, in 2023, the Energy Institute’s Statistical Review of World Energy recorded global fossil fuel consumption at 505 exajoules — a 67 percent absolute increase from 1990 [7]. The same publication described the world as being in “energy addition mode, rather than a clear transition.” That is not the language of an independent critic. It is the assessment of the organization that compiles the data the system runs on.
What the Record Shows
Look at the two charts again. Six arrows in the first. Five in the second. Each drawn at a moment when the red line was already rising. Each pointing steeply downward. None touching the line that followed.
This record does not support the interpretation that the world tried and fell short. It supports a different one: that the targets were designed to satisfy the demand for action without bearing its cost. The cost of genuine decarbonization — restructuring industrial systems built over a century, constraining growth in nations where hundreds of millions still lack reliable electricity, eliminating fossil subsidies that keep food and heat affordable for the world’s poor, pricing carbon at levels that actually change behavior — was never embedded in any of these agreements. What was embedded was language. Language about peaking. Language about transitions. Language about pursuing efforts. Language that could be signed without consequence and celebrated without accountability.
The data available at every signing was sufficient to reveal the problem. At Rio in 1992, fossil fuels were 86 percent of primary energy and rising in absolute volume. At Kyoto in 1997, the world’s two largest future emitters were outside the agreement entirely. At Paris in 2015, the UNFCCC’s own synthesis showed a 2.7°C trajectory on the same day the 1.5°C goal was signed. At Glasgow and Dubai, fossil consumption was setting new records while the same 2030 milestone was solemnly reaffirmed. A commitment made without any serious reckoning with what achieving it would require is not ambition. It is its opposite.
The victims of this thirty-year pattern are not the organizations that perpetuated it. They are the billions of people whose futures depend on an accurate reckoning with one of the most consequential physical problems in human history — and who were instead offered a scoreboard that was never designed to show the real score.
What Honest Accounting Requires
None of this means the problem is beyond address, or that thirty years of negotiation produced nothing of value. International frameworks matter. Scientific consensus, painstakingly built, matters. The dramatic cost reductions in solar and wind power over this period are real and consequential. The question is not whether to act. It is whether to act on an accurate map or a flattering one.
An honest accounting begins with acknowledgments the institutional discourse has consistently avoided. The 1.5°C target is no longer a goal — it is a threshold already crossed on an annual basis and will be crossed permanently within this decade regardless of any action now plausible. Net-zero by 2050 roadmaps without credible 2030 pathways are not plans; they are intentions dressed as commitments. The dominant reason global emissions have not declined is not insufficient ambition in the language of agreements — it is the absence of any mechanism capable of overriding the economic logic that makes fossil fuel consumption rational for the billions of people and hundreds of governments that depend on it.
Fossil fuels are structurally embedded in the global economy in ways that decades of climate diplomacy consistently failed to confront. The fertilizer that feeds half the world runs on natural gas. The steel in every wind turbine was made with coal. The ships that carry solar panels across the ocean burn bunker fuel. None of the agreements examined here contained a credible account of how those dependencies would be unwound, on what timeline, at what cost, and who would bear it.
Until that accounting exists — honest, specific, and priced — the targets will continue to be set. The line will continue to rise. And the arrows will continue to point in a direction the world has never traveled.
References & Notes
[1] S.Res.98, 105th Congress, July 25, 1997. Byrd-Hagel Resolution. Passed 95-0. https://www.congress.gov/bill/105th-congress/senate-resolution/98
[2] UNFCCC. Synthesis report on the aggregate effect of INDCs, October 2015. https://unfccc.int/sites/default/files/resource/docs/2015/cop21/eng/07.pdf
[3] IPCC. Special Report on Global Warming of 1.5°C (SR1.5), 2018. Remaining carbon budget: ~420 GtCO₂ from 2018 for 66% probability of staying below 1.5°C. https://www.ipcc.ch/sr15/
[4] IPCC AR6 Working Group III, Chapter 3, 2022. ~43% reduction from 2019 levels by 2030 required for 1.5°C pathway (interquartile range 34–60%). https://doi.org/10.1017/9781009157926
[5] Climate Analytics. Latest science on the 1.5°C limit of the Paris Agreement, August 2025. Human-induced warming rate 0.27°C/decade 2015–2024. https://climateanalytics.org/publications/latest-science-on-the-1-5-c-limit-of-the-paris-agreement
[6] Climate Action Tracker. CAT Net Zero Target Evaluations, October 2025. ~145 countries, ~77% of global emissions. https://climateactiontracker.org/global/cat-net-zero-target-evaluations/
[7] Energy Institute. Statistical Review of World Energy 2024, 74th edition. Global fossil fuel consumption 505 EJ in 2023; +67% vs. 1990. https://www.energyinst.org/statistical-review
[8] Global Carbon Project. Global Carbon Budget 2024 (Friedlingstein et al., 2025). Fossil CO₂ 37.4 GtCO₂ in 2024 — record high. https://doi.org/10.5194/essd-17-965-2025
[9] Climate Action Tracker. Emissions pathways to 2100, November 2025. Current policies: ~2.7°C trajectory. https://climateactiontracker.org/global/emissions-pathways/
[10] Erisman, J.W. et al. (2008). How a century of ammonia synthesis changed the world. Nature Geoscience 1, 636–639. Haber-Bosch process sustains ~50% of global population via nitrogen fertilizer. https://doi.org/10.1038/ngeo325
[11] IEA. Global Energy Review 2025. Energy-related CO₂ emissions 37.8 Gt in 2024; atmospheric CO₂ 422.5 ppm. https://www.iea.org/reports/global-energy-review-2025/co2-emissions
[12] NOAA Climate.gov. Climate change: atmospheric carbon dioxide. CO₂ growth rate accelerating: 2.6 ppm/yr average 2015–2024. https://www.climate.gov/news-features/understanding-climate/climate-change-atmospheric-carbon-dioxide
[13] Global fossil fuel primary energy 1990 (~316 EJ): derived from total primary energy 8,795 Mtoe (IEA/ScienceDirect) × ~86% fossil share. Confirm against EI Statistical Review historical Excel workbook.
Thank you for this write up. I would love to see high res versions of the two graphs because the legends and labels are unreadable in the low resolution Substack post. Can you post a link to the high res versions if you have it? Much appreciated.
Thank you, Scott, for this important article! It motivated me to design a potential viral campaign. Here is the draft script, what do you think?
The Curve 26
[Chart: pledges vs. actual emissions — the gap]
Every line going down was a promise. The line going up is real.
Open http://Claude.ai or another AI chat. Paste this: “I want to help close the gap between climate pledges and actual emissions. Given my situation [job, location, special skills, hobbies, talents, influence and limitations], give me a ranked, evidence-based list of up to 26 high-leverage actions toward this (political action weighted higher than individual consumption according to scientific evidence) adjusted up for anything where my specific skills or platform give me unusual reach. State confidence levels.”
Get your list. Act on one from your top 5 actions today. If you're fired up, act on the whole list by the end of 2026. And tell us about it!