The Energy Density Ladder, the Reversal
For centuries the density of human energy systems increased, until wind and solar

The problem
The exercise sounded simple: list every energy source humanity has adopted, in order, and attach a common measure of energy density to each. The hypothesis was that each generation of technology delivered a denser source than the one before. The first attempt used the standard metric, megajoules per kilogram of fuel. It works well for the fuel era. Dry wood carries about 16 MJ/kg, coal roughly 24-30, crude oil 42-47, natural gas 42-55, and enriched reactor fuel several million [1]. A clean, rising ladder.
Then the ladder breaks. Wind and solar have no fuel. The air moving through a turbine at rated speed carries about 0.00007 MJ/kg. Sunlight is massless, so its gravimetric density is undefined. Any chart that includes the two fastest-growing sources of new generation cannot be built on MJ/kg at all.
Two metrics that almost work
Land-area power density, watts per square meter of ground committed, is the usual substitute. It puts fuels and flows on one axis and shows wind at roughly 2 W/m2 and solar at 7, against hundreds for fossil and nuclear plants; a meta-analysis of 177 published estimates found non-renewable densities about three orders of magnitude above renewable ones [2]. But it measures footprint, not the fuel itself, and footprint arguments invite endless boundary disputes about what land counts.
A second candidate treats the machine as the fuel: lifetime electricity delivered per kilogram of total mass mobilized, plant plus fuel plus materials. This one produces a surprise. Wind and solar beat coal and gas by an order of magnitude, because a fossil plant consumes hundreds of thousands of tonnes of fuel per terawatt-hour while a wind farm mobilizes roughly 10,000 tonnes of steel, concrete, and other materials per TWh, once, and solar about 16,000 [3]. Nuclear, near 1,000 tonnes per TWh with fuel a rounding error, still wins by another factor of ten. The metric is honest but incomplete: cheap steel masks in mass terms a penalty that shows up unmistakably in size, land, and transmission.
The metric that resolves it
The measure that finally captures the intuition is power density at the conversion interface: watts crossing each square meter of the one surface where energy actually changes form, averaged over a full year. Every technology has such a surface. For wood it is the fire grate; for coal, the burner zone of the boiler; for gas, the turbine combustor; for nuclear, the cross-section of the reactor core. For wind it is the disc swept by the blades, and for solar the panel face, because for these two the collection surface and the conversion surface are the same thing.
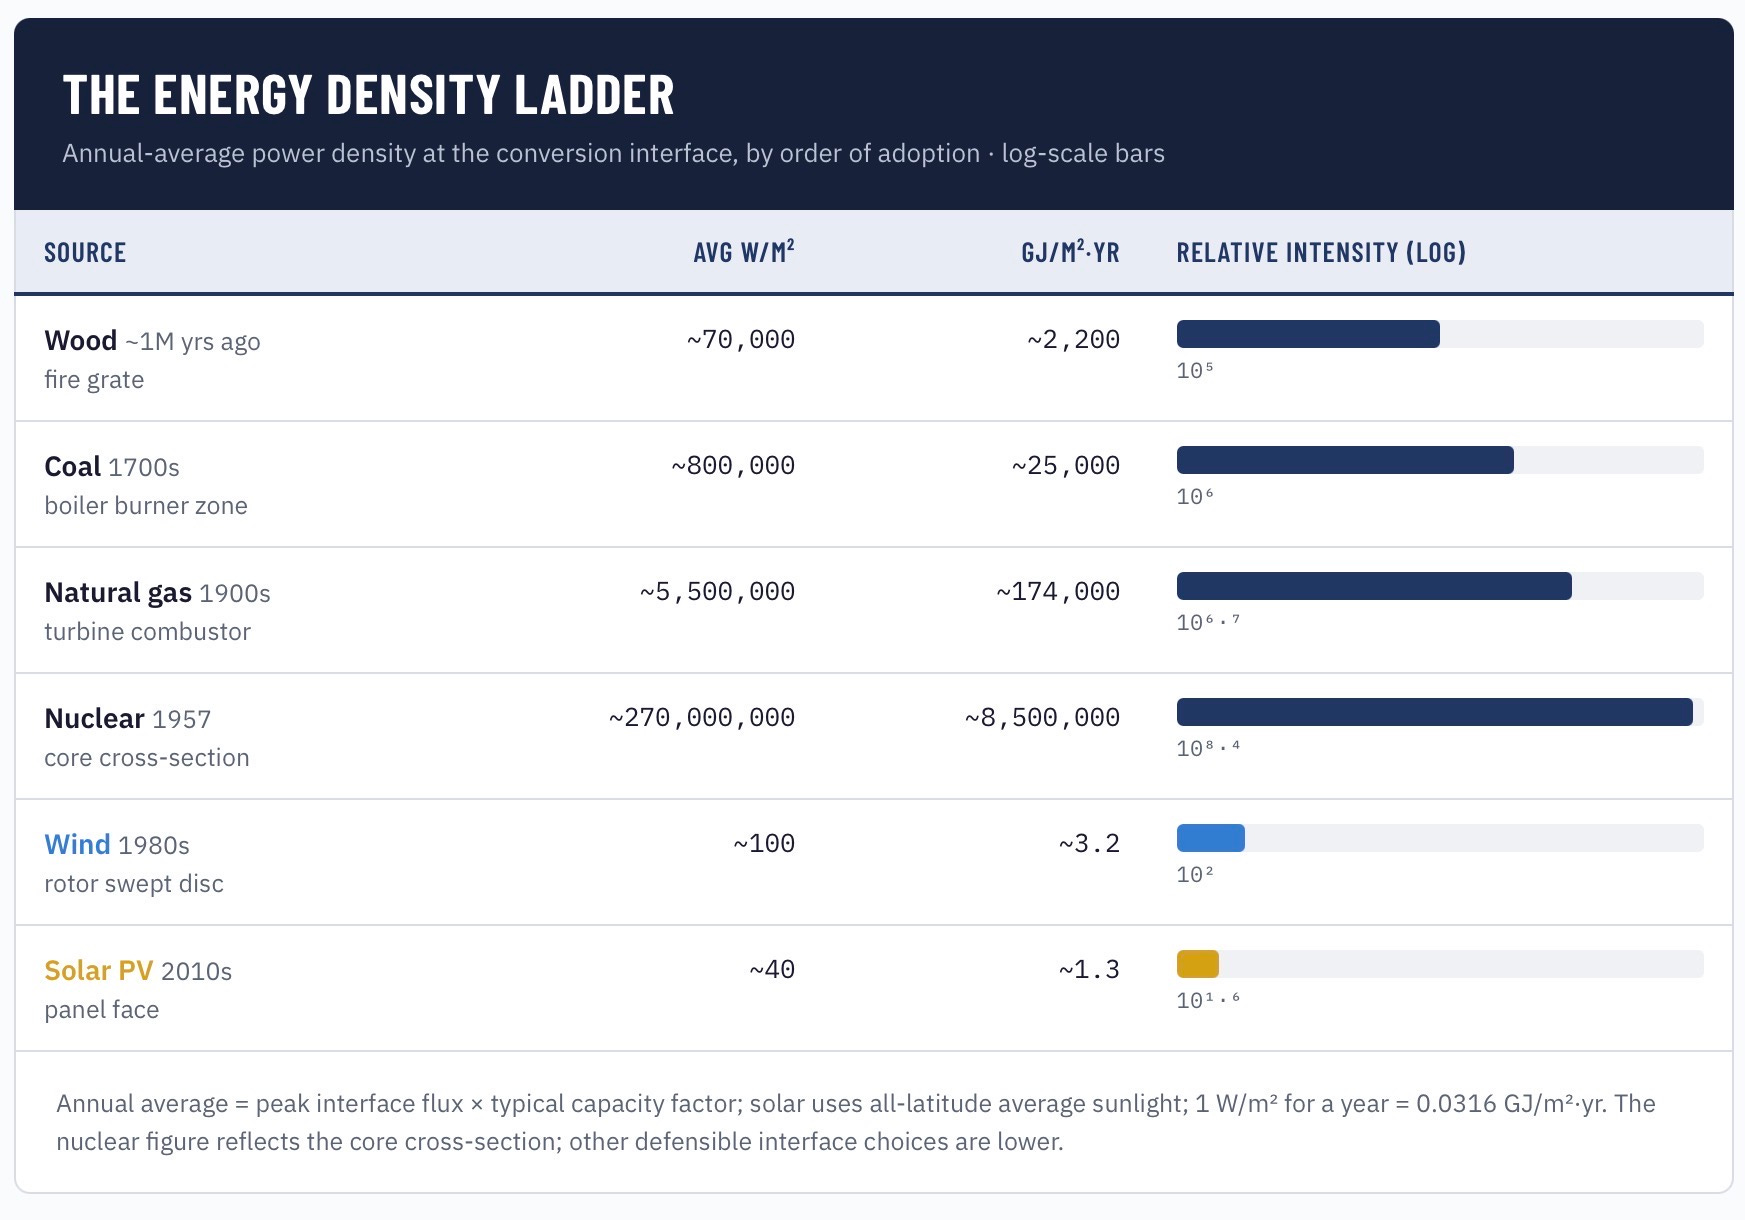
Averaged over a full year at typical capacity factors, the six sources line up as follows. Wood, in use for roughly a million years, runs about 70,000 W/m2 at the grate. Coal, adopted at scale in the 1700s, reaches about 800,000 W/m2 in the burner zone [4, 10]. Natural gas, scaled in the 1900s, pushes roughly 5,500,000 W/m2 through the combustor [5]. Nuclear, from 1957, delivers on the order of 270,000,000 W/m2 across the core cross-section [6]. Then the sequence reverses. Wind, deployed at utility scale from the 1980s, averages about 100 W/m2 over its swept disc: modern turbines are rated near 230 W of capacity per m2 of rotor area and run at roughly 36-41% capacity factor [7]. Solar PV, scaled in the 2010s, averages about 40 W/m2 at the panel face on an all-latitude basis: roughly 185 W/m2 of average surface sunlight [8] converted at about 20% module efficiency. The fuel era climbed nearly four orders of magnitude in intensity from the campfire to the reactor core. The two newest sources sit roughly three orders of magnitude below the campfire.
Please note the bars below are logarithmic.
Why the metric works
A fuel decouples collection from conversion. Coal is ancient photosynthesis, captured at perhaps half a watt per square meter, accumulated over millions of years and compressed by geology into a seam. The concentration work, roughly a million-fold, was performed before anyone arrived. A power plant therefore only has to build the converter, which can be small and ferociously intense.
Wind and solar re-couple collection and conversion. The machine must physically be the collection aperture, operating at ambient flux, for its entire service life. Sunlight cannot be made to arrive faster and wind cannot be made to blow harder, so the only route to more power is more square meters, which means more steel, more land, and more wire. Nearly every downstream property of an energy system, machine size, materials per megawatt, land take, transmission burden, scales from the intensity of this one surface. That is what makes it a fair basis of comparison, and it is the quantity the original intuition was tracking all along.
Sourcing and judgment
The figures rest on two different footings. Fully referenced: the fuel heat values [1]; the land-area power densities [2]; the materials intensities [3]; average surface sunlight [8]; fleet capacity factors for nuclear (92-93%), gas (about 60%), wind (34%), and solar (23%) [9], and wind turbine specific power [7]. The wind and solar rows are therefore essentially referenced arithmetic. Two figures lean more on judgment. The nuclear number is computed from published core power densities [6] and standard core geometry; a different but equally defensible interface choice would lower it substantially. The wood-grate figure is the softest in the table, drawn from grate-firing design practice rather than a single published value. Neither call changes the result: the wind and solar gap of three-plus orders of magnitude survives every defensible choice of interface.
The finding
Measured at the conversion interface, energy history is a 250-year climb in intensity, culminating in 1957, followed by the deployment at scale of the two least interface-dense sources humans have ever used. That is neither an argument against wind and solar nor a complete account of their economics. It is a physical fact, and it explains why the current buildout is more land-hungry, materials-intensive, and transmission-heavy than any energy addition that preceded it.
References
[1] Engineering Toolbox, Fuels: Higher and Lower Calorific Values. https://www.engineeringtoolbox.com/fuels-higher-calorific-values-d_169.html
[2] van Zalk, J. and Behrens, P. (2018). The spatial extent of renewable and non-renewable power generation: A review and meta-analysis of power densities and their application in the U.S. Energy Policy 123, 83-91. https://www.sciencedirect.com/science/article/pii/S0301421518305512
[3] US Department of Energy, Quadrennial Technology Review 2015, Table 10.4 (materials per TWh). https://www.energy.gov/quadrennial-technology-review-2015 ; tabulated at World Nuclear Association, Mineral Requirements for Electricity Generation. https://world-nuclear.org/information-library/energy-and-the-environment/mineral-requirements-for-electricity-generation
[4] Babcock & Wilcox, Steam: Its Generation and Use (burner zone and furnace heat release rates). Print reference.
[5] Lefebvre, A. and Ballal, D., Gas Turbine Combustion (combustor heat release intensity). Print reference.
[6] EPRI NP-380-SR, Power Reactor Pressure Vessel Benchmarks (LWR core power densities of 30-105 kW/liter). https://www.osti.gov/servlets/purl/7257538
[7] Lawrence Berkeley National Laboratory, Land-Based Wind Market Report: 2022 Edition (specific power 231 W/m2 for 2021 installs; fleet capacity factor 36%, 41.4% for 2014-2019 vintages). https://escholarship.org/content/qt48j7s9v1/qt48j7s9v1.pdf
[8] NASA Earth Observatory, Climate and Earth’s Energy Budget (340 W/m2 top-of-atmosphere average; about 48% absorbed at the surface). https://science.nasa.gov/earth/earth-observatory/climate-and-earths-energy-budget/
[9] US Department of Energy, What is Generation Capacity? (2024 capacity factors: nuclear 92%, gas 59.9%, coal 42.4%, wind 34.3%, solar 23.4%). https://www.energy.gov/ne/articles/what-generation-capacity
[10] US Energy Information Administration, Today in Energy, June 2021 (coal fleet capacity factor 72% in 2008, 40% by 2020; the coal figure here uses the baseload-era value). https://www.eia.gov/todayinenergy/detail.php?id=47196
Interesting analysis. Nice work.
Should one also normalize for capacity factor? I can keep a campfire burning indefinitely by continuing to feed it wood, but when the wind stops blowing or the sun sets it’s over. Another source that used in some parts of the world for energy is dung, in the U.S. it appears to be the basis of popular energy policy.